
Transform Your Kubernetes CLI Experience: Writing K9s Plugins by Leveraging Inspektor Gadget
K9s is a robust terminal-based user interface designed to facilitate interaction with Kubernetes clusters. It enhances the Kubernetes CLI experience by offering various methods to efficiently manage and interact with applications. Additionally, K9s supports the creation of custom plugins, for advanced functionality to make the most out of your Kubernetes CLI experience. This blog post will explore how we can take existing eBPF powered Inspektor Gadget gadgets off the shelf, and transform them into powerful K9s plugins to enhance the observability of your Kubernetes clusters while using the K9s TUI.
K9s Plugins
To write plugins that leverage Inspektor Gadget, we must first understand how plugins work. A plugin lets you set a shortcut to trigger a command in different
scopes like cluster, node, pods, and containers. All of this is defined in a file located at $XDG_CONFIG_HOME/k9s/plugins.yaml.
You can use following command to get plugins.yaml path on your machine:
$ k9s info
...
Plugins:           /home/qasim/.config/k9s/plugins.yaml
...
To install, copy the YAML definition of a plugin to the plugins file. For instance, the following plugin configuration enables viewing logs on a selected pod using the CTRL-L:
# $XDG_CONFIG_HOME/k9s/plugins.yaml
plugins:

  # Defines a plugin to provide a `ctrl-l` shortcut to tail the logs while in pod view.
  fred:
    # Define a mnemonic to invoke the plugin
    shortCut: Ctrl-L
    # What will be shown on the K9s menu
    description: Pod logs
    # Collections of views that support this shortcut. (You can use `all`)
    scopes:
    - po
    # The command to run upon invocation. Can use Krew plugins here too!
    command: kubectl
    # Whether or not to run the command in background mode
    background: false
    # Defines the command arguments
    args:
    - logs
    - -f
    - $NAME
    - -n
    - $NAMESPACE
    - --context
    - $CONTEXT
Please feel free to check K9s documentation for more information.
Trace DNS Plugin
Now that we understand the K9s plugin, let us explore and utilize one of the plugins based on Inspektor Gadget DNS gadget. The trace_dns plugin
is part of Community Custom Plugins and was recently released as part v0.40.0.
Once installed, it allows tracing DNS requests in your cluster using Shift-d in different views. Let us see how it looks in action:
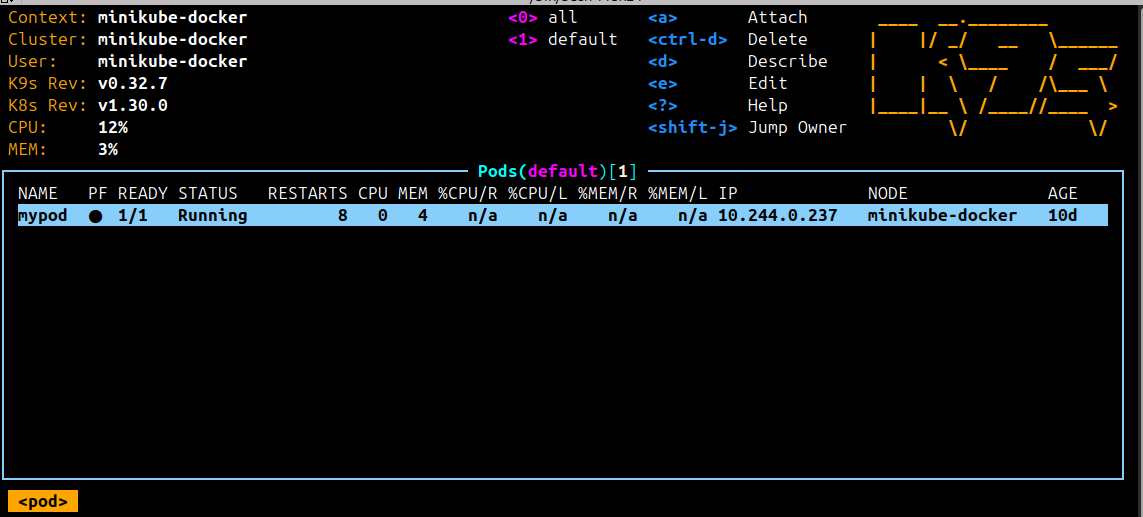
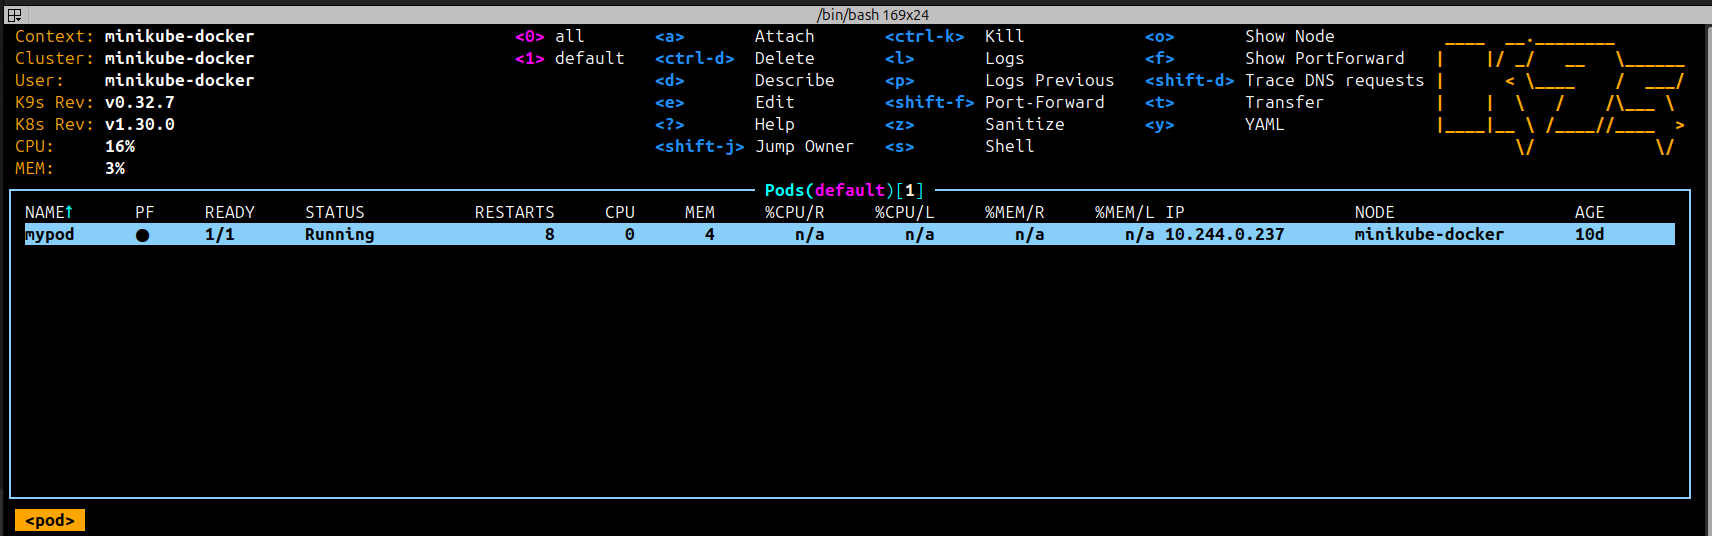
Pod View
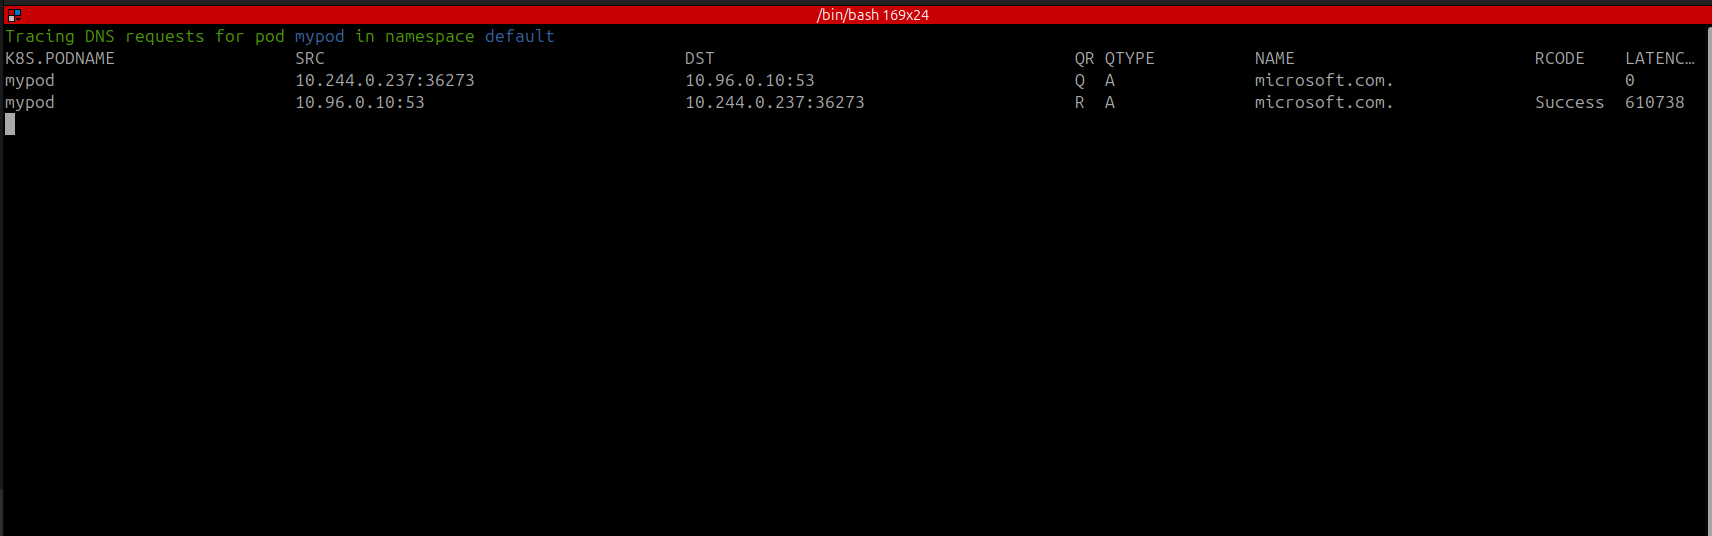
In the pod view, you can trace DNS requests for a specific pod by selecting the pod and pressing Shift-D. The following screenshot shows the DNS requests for the pod mypod:
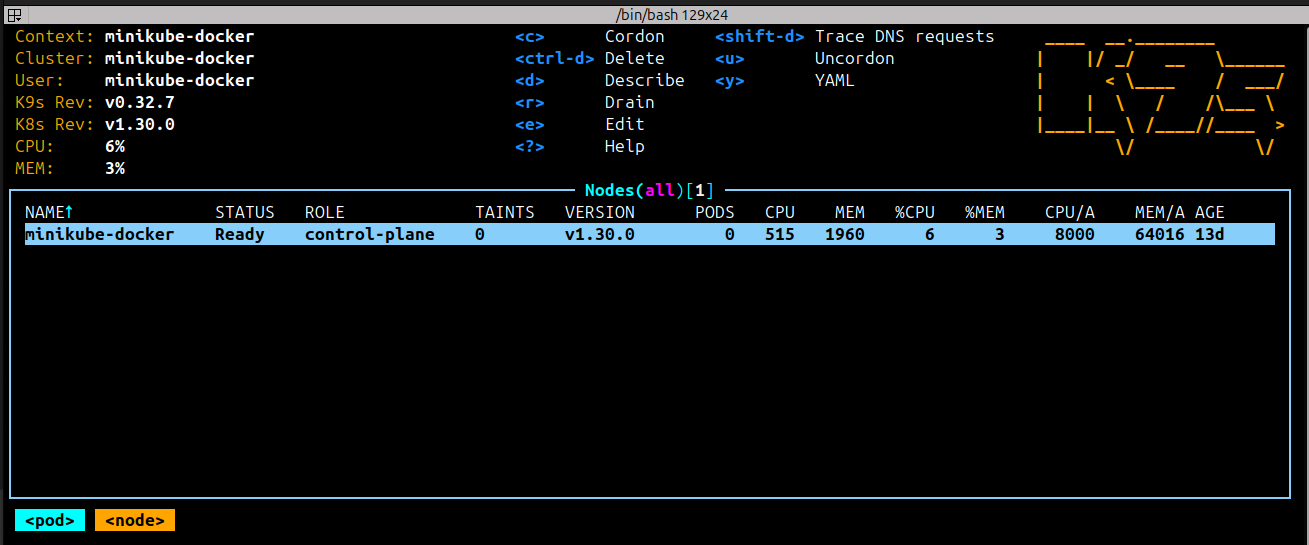
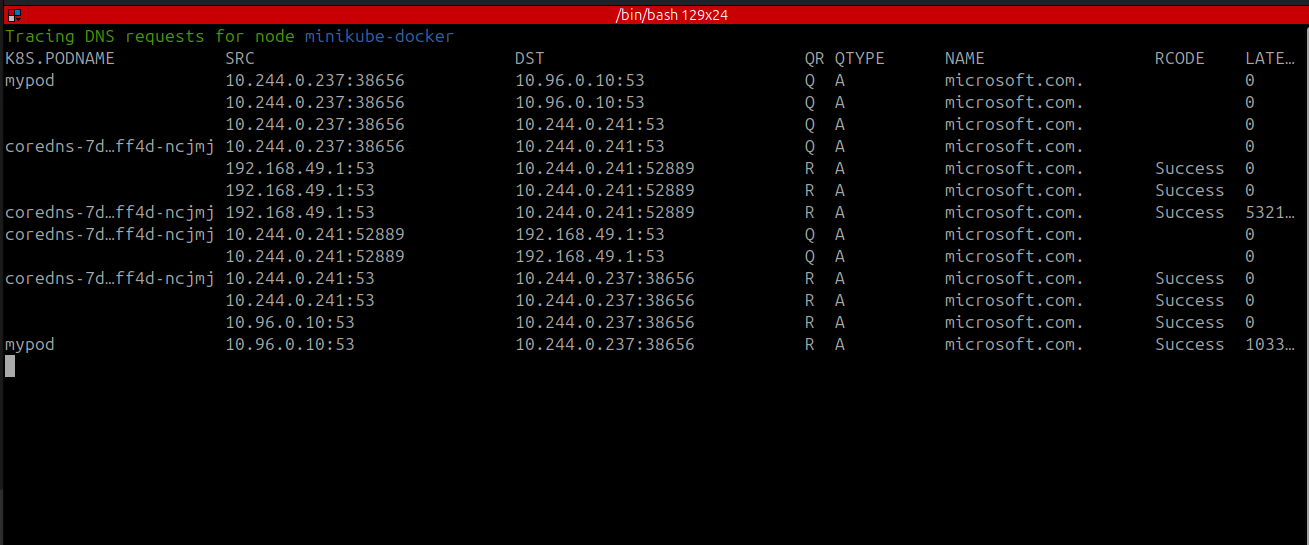
Node View
In the node view, you can trace DNS requests for a specific node by selecting the node and pressing Shift-D. The following screenshot shows the DNS requests for the node minikube-docker:
How It Works
Now that we have seen how the trace-dns plugin looks in action, let us go behind the scenes and understand how it is implemented. It is a simple bash script based on following ideas:
- Uses the Inspektor Gadget DNS gadget to trace DNS events.
- Utilizes kubectl debug node to trace Kubernetes workloads with Inspektor Gadget.
- Determines the scope by checking the presence of certain plugin environment variables.
# Author: Qasim Sarfraz
# Trace DNS requests for containers, pods, and nodes
# Requires kubectl version 1.30 or later
# https://github.com/inspektor-gadget/inspektor-gadget
# https://www.inspektor-gadget.io/docs/latest/gadgets/trace_dns
plugins:
  trace-dns:
    shortCut: Shift-D
    description: Trace DNS requests
    scopes:
      - containers
      - pods
      - nodes
    command: bash
    confirm: false
    background: false
    args:
      - -c
      - |
        IG_VERSION=v0.34.0
        IG_IMAGE=ghcr.io/inspektor-gadget/ig:$IG_VERSION
        IG_FIELD=k8s.podName,src,dst,qr,qtype,name,rcode,latency_ns

        GREEN='\033[0;32m'
        RED='\033[0;31m'
        BLUE='\033[0;34m'
        NC='\033[0m' # No Color

        # Ensure kubectl version is 1.30 or later
        KUBECTL_VERSION=$(kubectl version --client | awk '/Client Version:/{print $3}')
        if [[ "$(echo "$KUBECTL_VERSION" | cut -d. -f2)" -lt 30 ]]; then
          echo -e "${RED}kubectl version 1.30 or later is required${NC}"
          sleep 3
          exit
        fi

        clear

        # Handle containers
        if [[ -n "$POD" ]]; then
          echo -e "${GREEN}Tracing DNS requests for container ${BLUE}${NAME}${GREEN} in pod ${BLUE}${POD}${GREEN} in namespace ${BLUE}${NAMESPACE}${NC}"
          IG_NODE=$(kubectl get pod "$POD" -n "$NAMESPACE" -o jsonpath='{.spec.nodeName}')
          kubectl debug --kubeconfig=$KUBECONFIG  --context=$CONTEXT -q \
            --profile=sysadmin "node/$IG_NODE" -it --image="$IG_IMAGE" -- \
            ig run trace_dns:$IG_VERSION -F "k8s.podName==$POD" -F "k8s.containerName=$NAME" \
            --fields "$IG_FIELD"
            exit
        fi

        # Handle pods
        if [[ -n "$NAMESPACE" ]]; then
          echo -e "${GREEN}Tracing DNS requests for pod ${BLUE}${NAME}${GREEN} in namespace ${BLUE}${NAMESPACE}${NC}"
          IG_NODE=$(kubectl get pod "$NAME" -n "$NAMESPACE" -o jsonpath='{.spec.nodeName}')
          kubectl debug --kubeconfig=$KUBECONFIG  --context=$CONTEXT -q \
            --profile=sysadmin  -it --image="$IG_IMAGE" "node/$IG_NODE" -- \
            ig run trace_dns:$IG_VERSION -F "k8s.podName==$NAME" \
            --fields "$IG_FIELD"
            exit
        fi

        # Handle nodes
        echo -e "${GREEN}Tracing DNS requests for node ${BLUE}${NAME}${NC}"
        kubectl debug --kubeconfig=$KUBECONFIG  --context=$CONTEXT -q \
          --profile=sysadmin -it --image="$IG_IMAGE" "node/$NAME" -- \
          ig run trace_dns:$IG_VERSION --fields "$IG_FIELD"
See how it is using the DNS gadget (ig run trace_dns) to run the gadget and selecting different fields using IG_FIELD.
Again, you need to copy the YAML definition to the plugins path which in my case it was ~/.config/k9s/plugins.yaml.
Taking It Further
The example above illustrates how to enhance K9s workflows with minimal code. It employed the trace_dns gadget, but users are free to select any suitable gadget from the Official Gadgets or perhaps create their own gadget for custom plugins. Some interesting ideas can be to see what processes are being spawned in a pod or to see open sockets by a pod to state of TCP connections. We invite you to try the plugin and provide any feedback or share an interesting use-case by writing your own plugin.