Using prometheus
This is an outdated way to use Prometheus in Inspektor Gadget. We'll soon provide documentation for the new mechanism.
The Prometheus gadget collects and exposes metrics in Prometheus format. It's available in both, for
Kubernetes (ig-k8s) and in Linux hosts (ig).
$ kubectl gadget prometheus --metrics-config @<path>
$ ig prometheus --metrics-config @<path> --metrics-listen-address $IP:$PORT --metrics-path /metrics
Configuration File
The configuration file defines the metrics to be exposed and their settings. The structure of this file is:
metrics_name: metrics_name
metrics:
  - name: metric_name
    type: counter or  gauge or histogram
    category: trace # category of the gadget to collect the metric. trace, snapshot, etc.
    gadget: exec # gadget used to collect the metric. exec, open, etc.
    selector:
      # defines which events to take into consideration when updating the metrics.
      # See more information below.
    labels:
      # defines the granularity of the labels to capture. See below.
Filtering (aka Selectors)
It's possible to configure Inspektor Gadget to only update metrics for some specific labels. This is useful to keep the cardinality of the labels low.
  selector:
  - "columnName:value" # matches if the content of the column is equals to value
  - "columnName:!value" # matches if the content of the column is not equal to value
  - "columnName:>=value" # matches if the content of the column is greater and equal to value
  - "columnName:>value" # matches if the content of columnName is greater than the value
  - "columnName:<=value" # matches, if the content of columnName is lower or equal to the value
  - "columnName:<value" # matches, if the content of columnName is lower than the value
  - "columnName:~value" # matches if the content of column matches the regular expression 'value'.
                        # see https://github.com/google/re2/wiki/Syntax for more information on the syntax.
Some examples are:
Only metrics for default namespace
selector:
  - k8s.namespace: default
Only events with retval != 0
selector:
  - "retval:!0"
Only events executed by pid 1 by non root users
selector:
  - "pid:0"
  - "uid:>=1"
Counters
This is the most intuitive metric: "A counter is a cumulative metric that represents a single monotonically increasing counter whose value can only increase or be reset to zero on restart. For example, you can use a counter to represent the number of requests served, tasks completed, or errors." from https://prometheus.io/docs/concepts/metric_types/#counter.
The following are examples of counters we can support with the existing gadgets. The first one counts the number of executed processes by namespace, pod and container.
metrics_name: my_metrics
metrics:
  - name: executed_processes
    type: counter
    category: trace
    gadget: exec
    labels:
      - k8s.namespace
      - k8s.podName
      - k8s.containerName
By default, a counter is increased by one each time there is an event, however it's possible to increase a counter using a field on the event too.
Executed processes by pod and container in the default namespace
metrics_name: metrics_name
metrics:
  - name: executed_processes
    type: counter
    category: trace
    gadget: exec
    labels:
      - k8s.podName
      - k8s.containerName
    selector:
      - "k8s.namespace:default"
Or only count events for a given command:
cat executions by namespace, pod and container
metrics_name: metrics_name
metrics:
  - name: executed_cats # ohno!
    type: counter
    category: trace
    gadget: exec
    labels:
      - k8s.namespace
      - k8s.podName
      - k8s.containerName
    selector:
      - "comm:cat"
DNS requests aggregated by namespace and pod
metrics_name: metrics_name
metrics:
  - name: dns_requests
    type: counter
    category: trace
    gadget: dns
    labels:
      - k8s.namespace
      - k8s.podName
    selector:
      - "qr:Q" # Only count query events
Gauges
"A gauge is a metric that represents a single numerical value that can arbitrarily go up and down" from https://prometheus.io/docs/concepts/metric_types/#gauge.
Right now only snapshotters are supported.
Examples of gauges are:
Number of processes by namespace, pod and container.
metrics_name: metrics_name
metrics:
  - name: number_of_processes
    type: gauge
    category: snapshot
    gadget: process
    labels:
      - k8s.namespace
      - k8s.podName
      - k8s.containerName
Number of sockets in CLOSE_WAIT state
metrics_name: metrics_name
metrics:
  - name: number_of_sockets_close_wait
    type: gauge
    category: snapshot
    gadget: socket
    labels:
      - k8s.namespace
      - k8s.podName
      - k8s.containerName
    selector:
      - "status:CLOSE_WAIT"
Histograms
"A histogram samples observations (usually things like request durations or response sizes) and counts them in configurable buckets. It also provides a sum of all observed values." from https://prometheus.io/docs/concepts/metric_types/#histogram. We support the same bucket configuration as described in https://github.com/cloudflare/ebpf_exporter#histograms.
Right now only trace gadgets are supported.
Example of histograms is:
Latency of DNS requests for all pods
metrics_name: metrics_name
metrics:
  - name: dns_requests_latency
    type: histogram
    category: trace
    field: latency
    bucket:
      min: 0
      max: 10
      multiplier: 100000 # 0.1ms
      type: exp2
      unit: ns
    selector:
      - "qr:R" # Latency is only calculated for response events
Guide
Let's see how we can use this gadget in different environments.
On Kubernetes
In this guide we'll use the Prometheus Service Discovery: it automatically detects the endpoints to scrape metrics from.
If you already have a Prometheus instance running in your cluster, be sure you provide it with the following configuration:
scrape_configs:
  - job_name: 'kubernetes-pods'

    scrape_interval: 1s
    scrape_timeout: 1s

    kubernetes_sd_configs:
    - role: pod

    relabel_configs:
    - source_labels: [__meta_kubernetes_pod_annotation_prometheus_io_scrape]
      action: keep
      regex: true
    - source_labels: [__meta_kubernetes_pod_annotation_prometheus_io_scheme]
      action: replace
      target_label: __scheme__
      regex: (https?)
    - source_labels: [__meta_kubernetes_pod_annotation_prometheus_io_path]
      action: replace
      target_label: __metrics_path__
      regex: (.+)
    - source_labels: [__address__, __meta_kubernetes_pod_annotation_prometheus_io_port]
      action: replace
      target_label: __address__
      regex: ([^:]+)(?::\d+)?;(\d+)
      replacement: $1:$2
Otherwise, you can just apply the config provided with this guide:
$ kubectl apply -f https://raw.githubusercontent.com/inspektor-gadget/inspektor-gadget/main/docs/examples/prometheus.yaml
namespace/monitoring created
serviceaccount/prometheus created
clusterrole.rbac.authorization.k8s.io/discoverer created
clusterrolebinding.rbac.authorization.k8s.io/prometheus-discoverer created
configmap/prometheus-server-conf created
deployment.apps/prometheus created
Create a port-forward session to Prometheus:
$ kubectl port-forward --namespace monitoring deployment/prometheus 9090:9090 &
Let's create a metric that reports processes executed:
# myconfig.yaml
metrics_name: guide
metrics:
  - name: executed_processes
    type: counter
    category: trace
    gadget: exec
    labels:
      - k8s.namespace
      - k8s.podName
      - k8s.containerName
Start the gadget
$ kubectl gadget prometheus --metrics-config @myconfig.yaml
INFO[0000] Running. Press Ctrl + C to finish
INFO[0000] minikube             | Publishing metrics...
Now, the executed_processes_total counter is available in Prometheus http://localhost:9090/graph?g0.expr=executed_processes_total&g0.tab=0&g0.stacked=0&g0.show_exemplars=0&g0.range_input=1m:
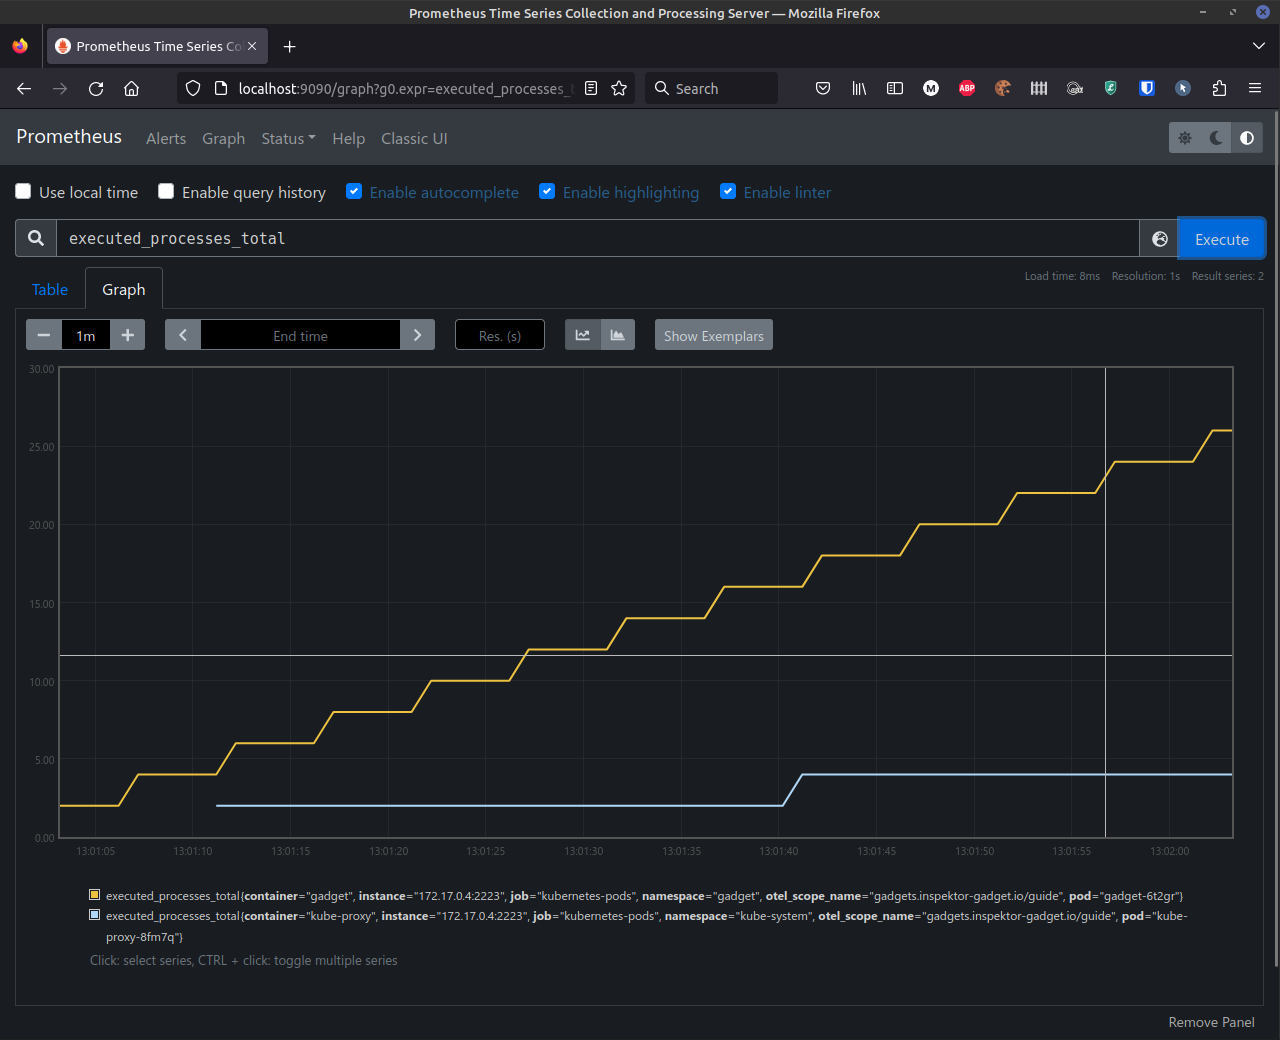
You can see that the counters are already going up for some containers.
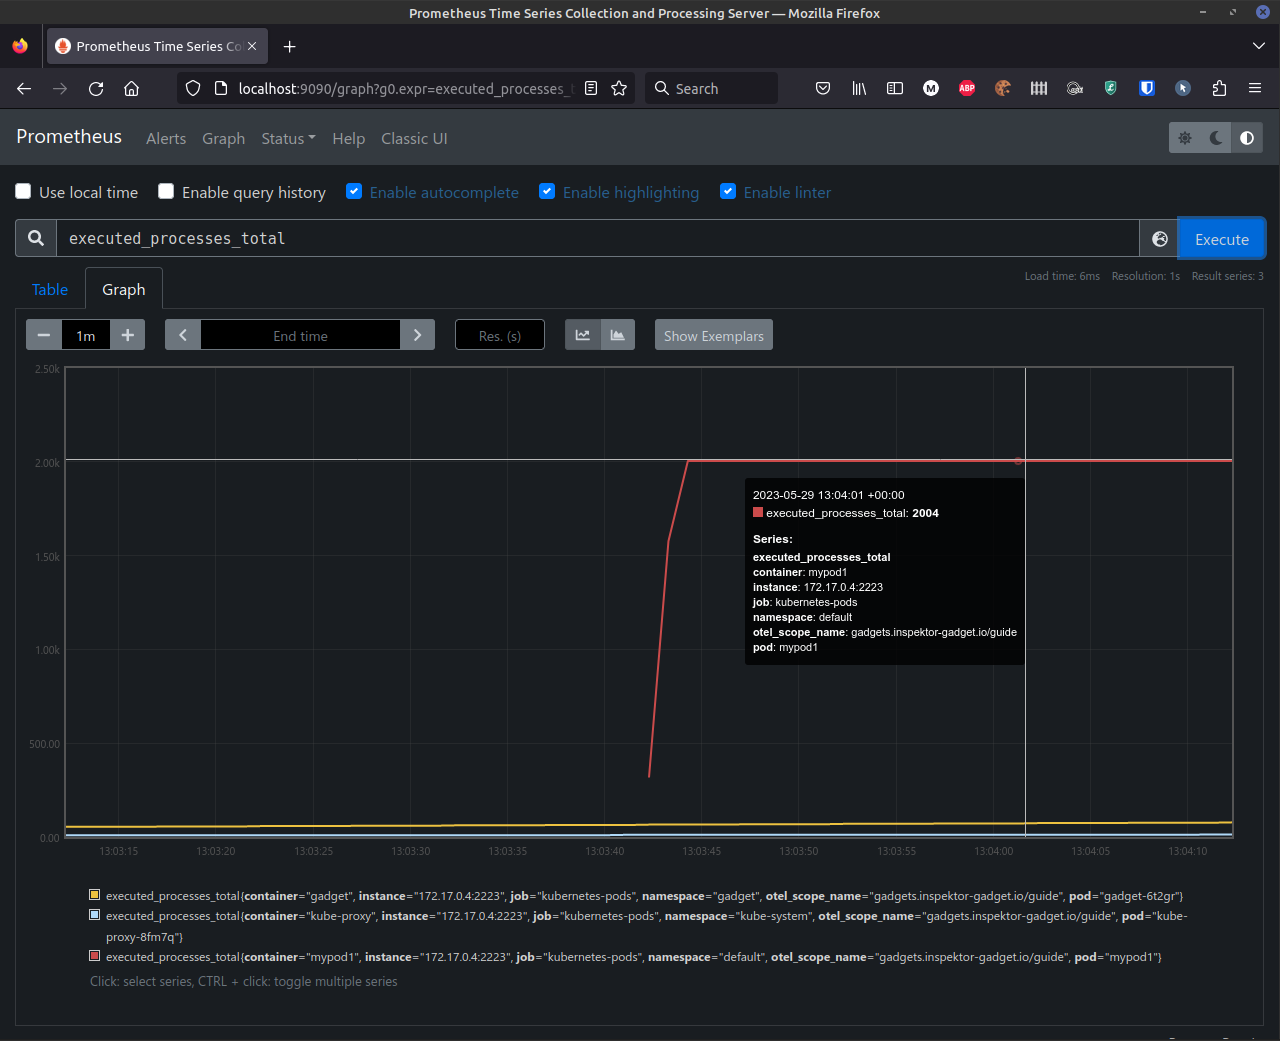
Let's create a pod to execute from more processes:
$ kubectl run mypod1 -it --image busybox --restart Never -- sh -c 'for i in $(seq 0 1 1000); do cat /dev/null ; ping -c 1 localhost > /dev/null; done'
If we check the counter again, we can see that it shows that our pod has executed a lot of processes:
Now, update the configuration file to only take into considerations executions of the cat binary:
# myconfig.yaml
metrics_name: guide
metrics:
  - name: executed_processes
    type: counter
    category: trace
    gadget: exec
    labels:
      - k8s.namespace
      - k8s.podName
      - k8s.containerName
    selector:
     - "comm:cat"
Restart the gadget
$ kubectl gadget prometheus --metrics-config @myconfig.yaml
INFO[0000] Running. Press Ctrl + C to finish
INFO[0000] minikube             | Publishing metrics...
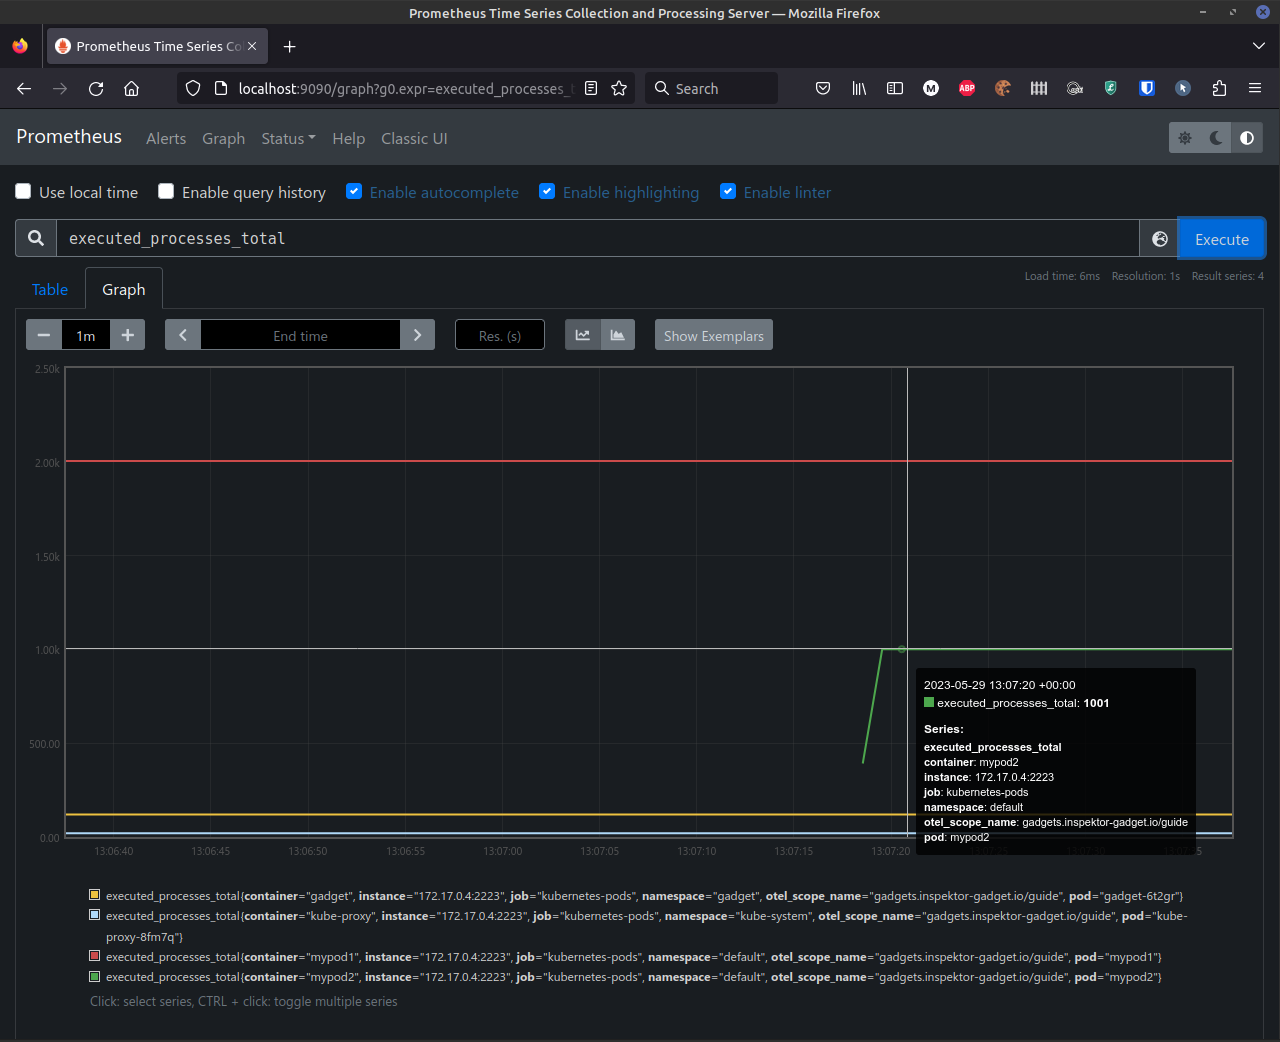
Create a new pod that executes processes:
$ kubectl run mypod2 -it --image busybox --restart Never -- sh -c 'for i in $(seq 0 1 1000); do cat /dev/null ; ping -c 1 localhost > /dev/null; done'
The counter only takes into consideration the cat commands now:
With ig
It's also possible to use the prometheus gadget without Kubernetes. In this case, we have to
configure Prometheus to point to the endpoint exposed by ig, it's localhost:2223 by default:
# prometheus.yaml
scrape_configs:
- job_name: ig
  scrape_interval: 1s
  static_configs:
  - targets:
    - localhost:2223
Start prometheus with above configuration (please refer to docker installation in case you want to run prometheus in a container).
$ prometheus --config.file prometheus.yaml
Then, start the prometheus gadget with the same configuration as above Kubernetes section:
$ sudo ig prometheus --metrics-config @myconfig.yaml
INFO[0000] Running. Press Ctrl + C to finish
INFO[0000] Publishing metrics...
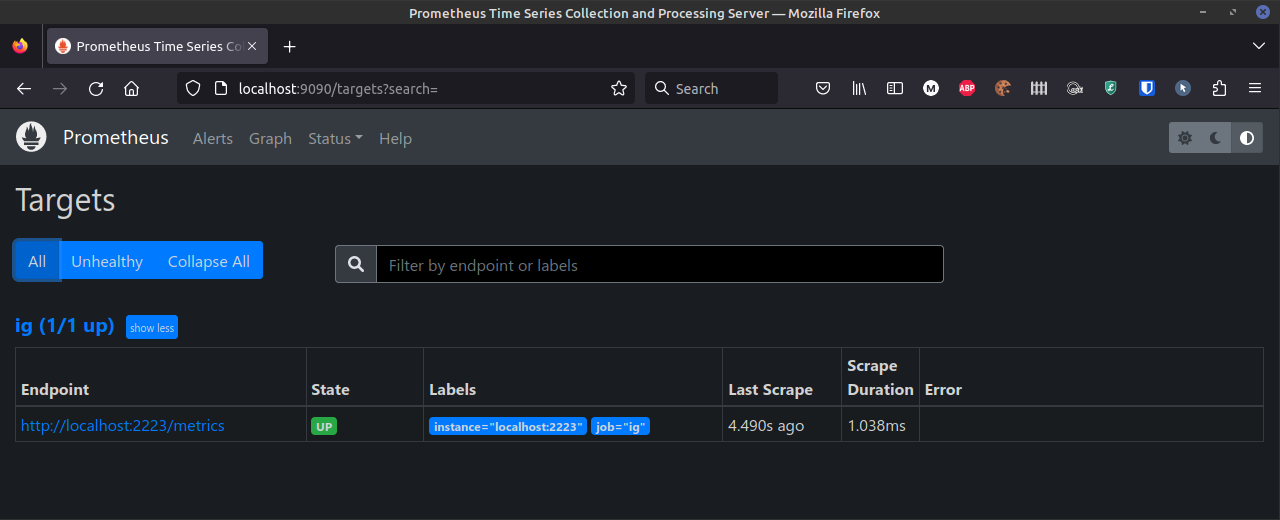
You can check in http://localhost:9090/targets and check that the ig endpoint is reporting metrics:
Let's execute some commands inside a container:
docker run --rm -ti --name=mycontainer busybox sh -c 'for i in $(seq 0 1 1000); do cat /dev/null ; ping -c 1 localhost > /dev/null; done'
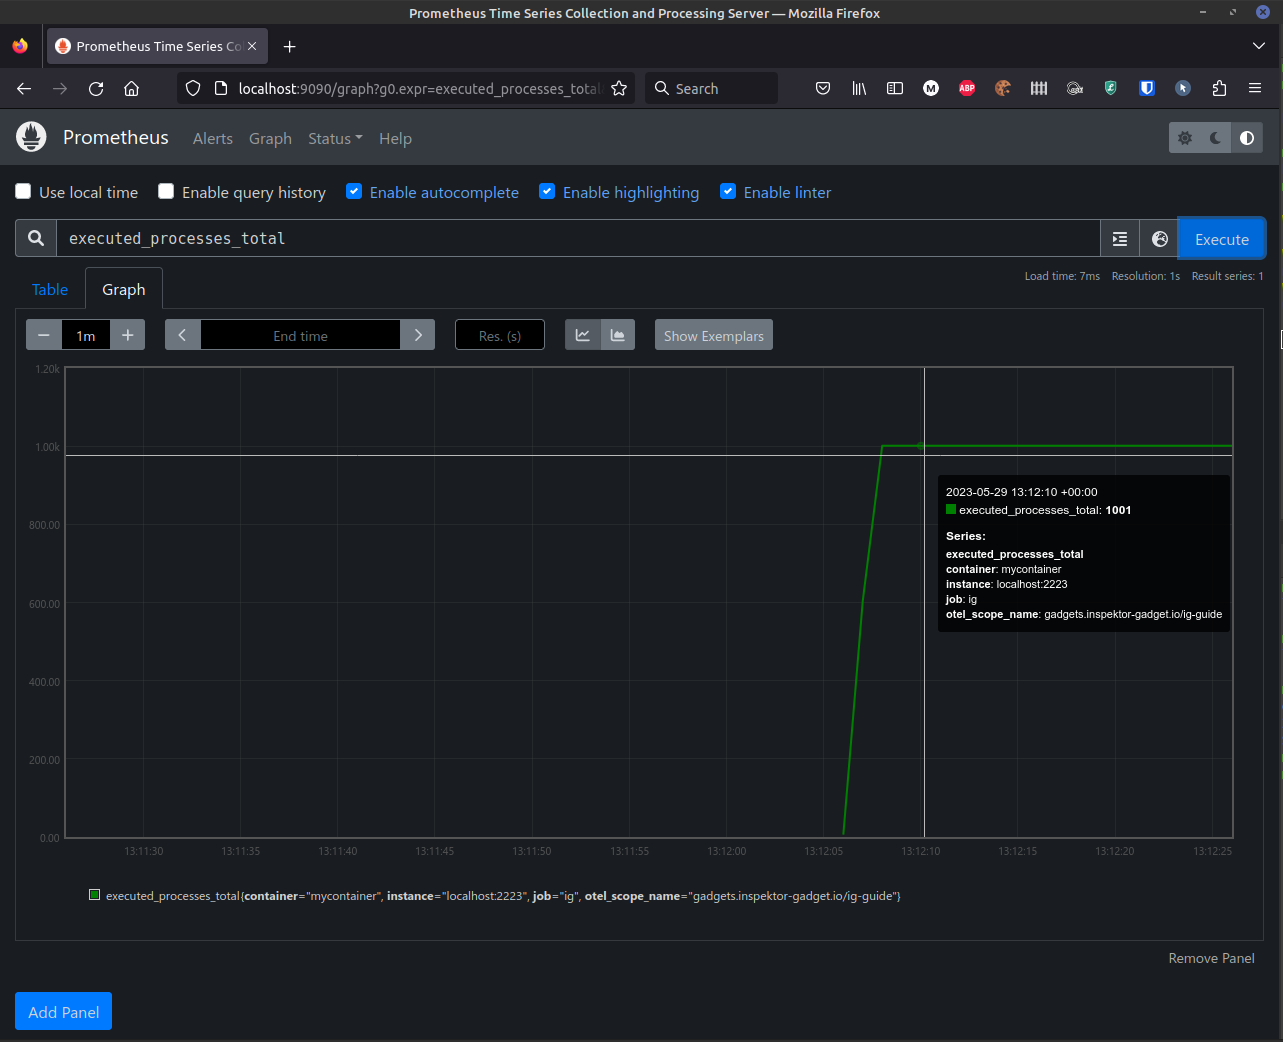
We can see how the counter for mycontainer is increased in http://localhost:9090/graph?g0.expr=executed_processes_total&g0.tab=0&g0.stacked=0&g0.show_exemplars=0&g0.range_input=1m.
Grafana
It's possible to visualize the metrics in Grafana. As an example we will plot a histogram for DNS requests latency. We can use the docker compose file to prepare the environment:
$ pushd tools/monitoring
$ docker compose up -d
$ popd
At this point, Grafana is available at http://localhost:3000 and Prometheus at http://localhost:9090. We can start ig
with the following configuration:
$ sudo ig prometheus --metrics-config @tools/monitoring/config/histogram.yaml
INFO[0000] Running. Press Ctrl + C to finish
Now, generate some DNS requests:
$ docker run --rm -ti busybox sh -c 'for i in $(seq 0 1 1000); do cat /dev/null ; nslookup -querytype=a microsoft.com. > /dev/null; done'
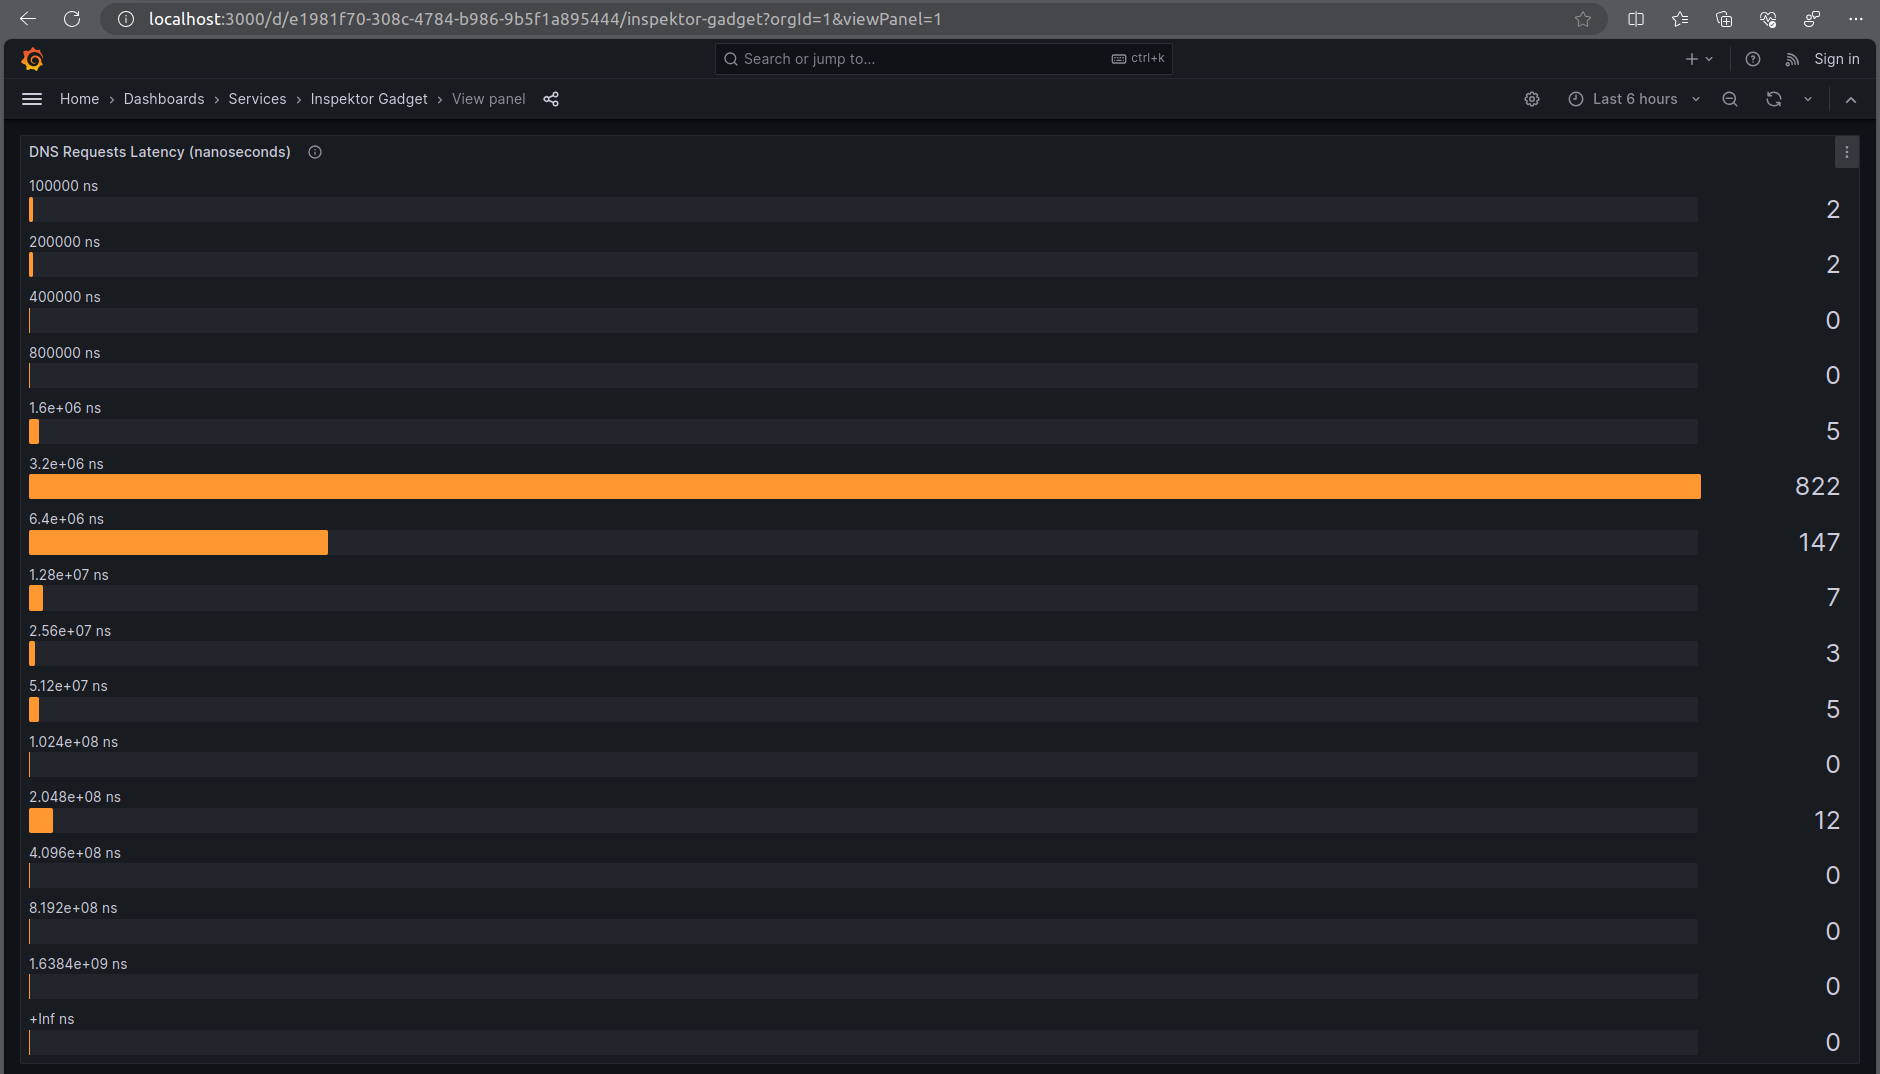
We should now be able to see the visualized histogram at: http://localhost:3000/d/e1981f70-308c-4784-b986-9b5f1a895444/inspektor-gadget?orgId=1&viewPanel=1
Limitations
- The
kubectl gadgetinstance has to keep running in order to update the metrics. - It's not possible to configure the metrics endpoint in ig-k8s